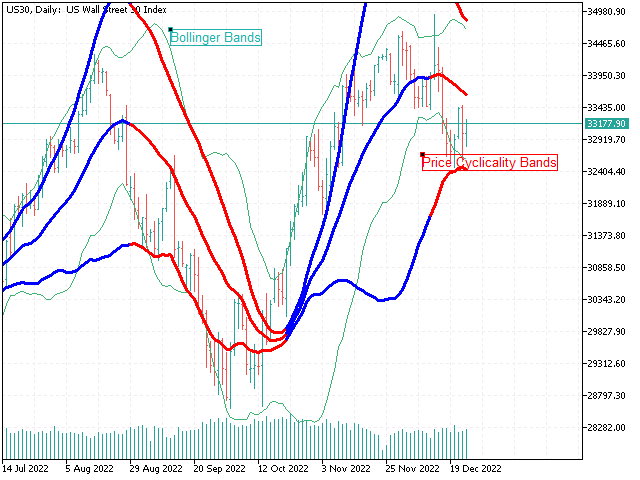
Price Cyclicality Bands
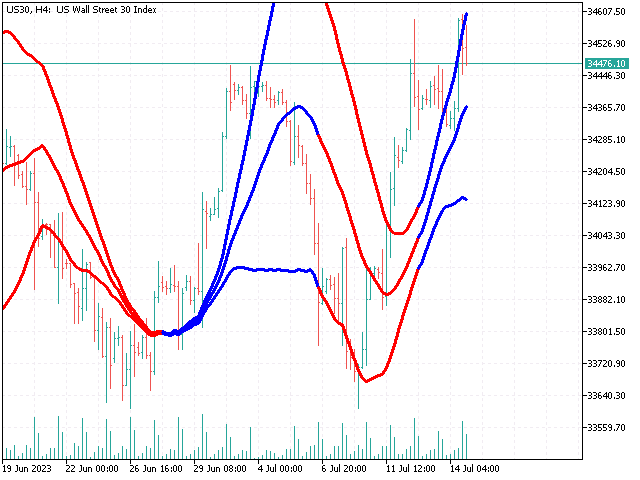
Price Cyclicality Bands defines the cycles of the price evolution for any financial market in a very specific way. The Price Cyclicality Bands are calculated by setting a simple moving average, and then adding or subtracting from the simple moving average value two standard deviations altered with the Price Cyclicality value to determinate the upper and lower bands. The Price Cyclicality Bands can be used to generate automated entry and exit trading signals near color changes intervals.
Version: 1.55
Last update:
15.07.2023
The efficiency of the Price Cyclicality Bands indicator was proved during the time, having a very precise evolution, especially in the long-time intervals (H1, H4, D1, W1) for every market. For the small timeframes (M1, M5, M15, M30), the Price Cyclicality Bands is a very good filter of false signals of many other known indicators like RSI, CCI, MACD etc. The indicator can be successfully used for manual trading or can be automated by importing the specific data series. The Price Cyclicality Bands is an important part of the algorithms included in successful expert advisors like Dow Jones Predictor, Gold Predictor, Nasdaq Retractor, or DAX Retractor.