Relative Cyclicality
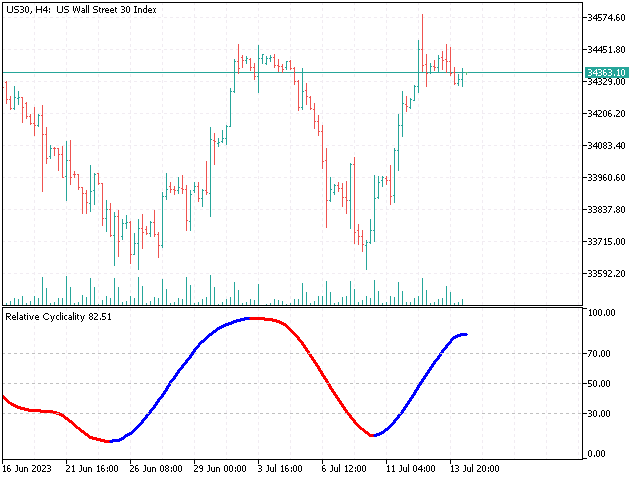
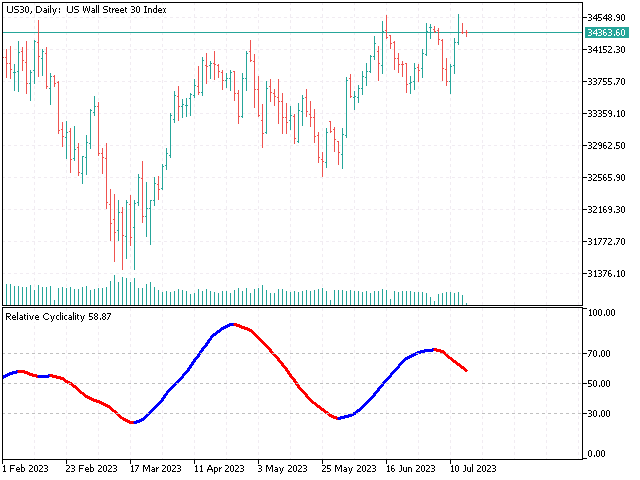
Relative Cyclicality defines the cycles of the price evolution for any financial market. The Relative Cyclicality is computed by applying the "Cyclicality" mathematical transformation to the classic Relative Strength Index indicator made by J. Welles Wilder. The Relative Cyclicality can be used to generate automated long entry signals near the minimal price values. Also, it can be used to define limit conditions to generate automated exit signals near the maximal price values. The Relative Cyclicality transformation has a specific optimal period for each market and timeframe.
Version: 1.55
Last update:
14.07.2023
The efficiency of the Relative Cyclicality indicator was proved during the time, having a very precise evolution, especially in the long-time intervals (H1, H4, D1, W1) for every market. For the small timeframes (M1, M5, M15, M30), the Relative Cyclicality is a very good filter of false signals of many other known indicators like RSI, CCI, MACD etc. The indicator can be successfully used for manual trading or can be automated by importing the specific data series. The Relative Cyclicality is an important part of the algorithms included in successful expert advisors like Dow Jones Predictor, Gold Predictor, Nasdaq Retractor, or DAX Retractor.