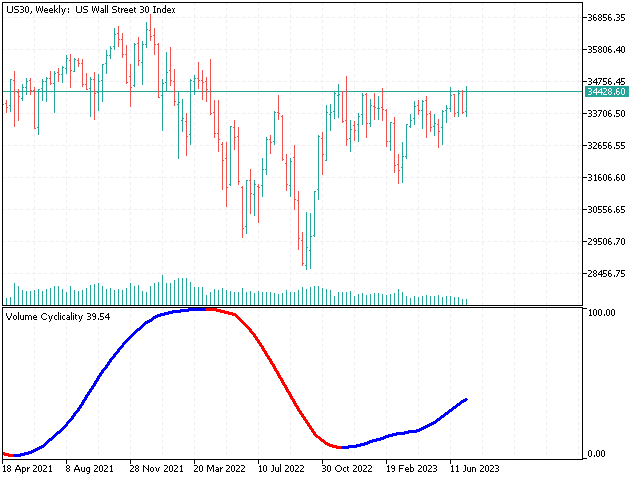
Volume Cyclicality
Volume Cyclicality defines the cycles of the trading volume evolution for any financial market. It shows clearly the ascending and descending volume intervals with asymptotic evolution near the minimum and maximum values. The Volume Cyclicality indicator can be successfully used in automated expert advisors to integrate the volume information together with the price evolution data. Also, it can be used to define limit conditions to generate automated exit signals depending on the volume evolution. The Volume Cyclicality transformation has a specific optimal period for each market and timeframe.
Version: 1.55
Last update:
14.07.2023
The efficiency of the Volume Cyclicality indicator was proved during the time, having a very precise evolution, especially in the long-time intervals (H1, H4, D1, W1) for every market. For the small timeframes (M1, M5, M15, M30), the Volume Cyclicality can be a filter of false signals made by other Cyclicality indicators. The indicator can be successfully used for manual trading or can be automated by importing the specific data series. The Volume Cyclicality is an important part of the algorithms included in successful expert advisors like Dow Jones Predictor and Dow Jones Trader .